CEC-Locean L3 Arctic V2
SMOS Arctic SSS L3 V2 maps produced by LOCEAN Expertise Center
J. Boutin1, J.-L. Vergely2 and D. Khvorostyanov1
1 LOCEAN, 2 ACRI-st
Overview
LOCEAN and ACRI-ST have derived improved level 3 (L3) SMOS Sea Surface Salinity (SSS) maps over the Arctic Ocean. With respect to SMOS ARCTIC SSS L3 V1.0, main changes in version 2.0 are as follows:
- 9-day and 18-day maps are provided over the June 2010 to August 2023 period,
- the methodology originally derived by Supply et al. [2020] and implemented in SMOS ARCTIC SSS V1 maps has been revisited,
- a temporal optimal interpolation with a bias removal depending on the SMOS observation geometry (see a general description in [Boutin et al., 2018]) has been added,
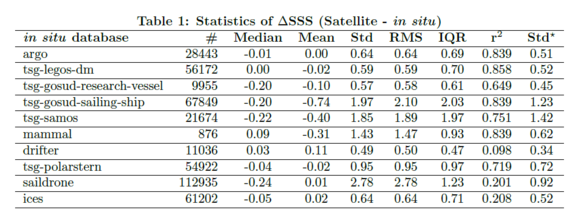
- comparisons with independent in situ datasets, conducted in CEC LOCEAN and in PIMEP, indicate a clear improvement (reduction of std difference by ~a factor 2 and systematic increase of r2); with V2.0 r2 is greater than 0.8 with 40% of the data sets considered at PIMEP.
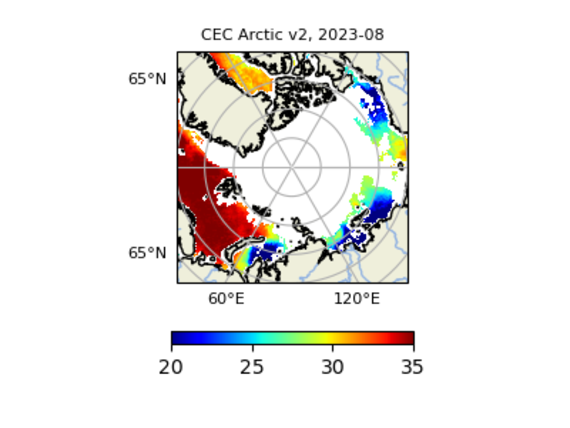
As in version 1, SSS maps are provided on an Equal-Scalable Earth Grid 2 (EASE, https://nsidc.org/data/ease) with a Northern Hemisphere Azimuthal projection and a resolution of 25km.
Figure 1 : SMOS SSS from CATDS CEC ARCTIC V2.0 in August 2023.
LOCEAN and ACRI-st work as Ocean Salinity Center of Expertise for CATDS (CATDS CEC-OS) in order to improve methodologies to be implemented in the future in the near real time CATDS processing chain (CATDS-CPDC). Feedbacks from users about the quality of these new products are very welcome, as they are experimental.
Introduction
The challenges of Arctic salinity processing are as follows:
- Redundant daily revisits at high latitudes are not present in the daily ascending and descending L3 CATDS SSS fields. It is therefore necessary to switch back to half-orbit ESA SMOS Level 2 (L2) products, which do not eliminate daily revisits.
- The global EASE grid used at CATDS for global SSS fields is not suitable for very high latitudes, due to its latitudinal sampling, which is too loose on the global grid.
- The sensitivity of the brightness temperatures to SSS is much reduced in cold water.
- Ice and land are much more emissive than the sea. The large emissivity discontinuities at the land-sea and ice-sea transitions contaminate SMOS signals from coast and from ice that necessitate corrections that depend on the grid point location and on the SMOS measurement geometry. But with respect to the corrections applied for generating global fields, in the Arctic Ocean:
- the extent of the contamination is up to ~1200km from the transition, so that given the particular geometry of the Arctic Ocean, land and ice contamination are superimposed,
- the ice edge is moving with a strong seasonality.
Summary of the methodology
The dataset is derived using the pseudo dielectric constant (ACARD parameter) retrieved by the ESA SMOS v700 level 2 ocean salinity processor (see a description of the algorithms in SMOS-L2OS-ATBD.pdf). The relationship between ACARD and the SSS is non linear [Boutin et al., 2021]. Hence, an iterative process has been applied to derive SSS from level 2 ACARD, using the [Boutin et al., 2023] dielectric constant model.
The ice edge is determined from a threshold put on ACARD averaged over 5days (ACARD < 40) and on the SST (8°C).
A systematic correction has been derived that depends on the grid point location and on the SMOS measurement geometry, following a methodology similar to the one described in [Boutin et al., 2018] but without applying a seasonal correction.
An uncertainty estimate is derived from the propagation of the SMOS ESA L2 uncertainties. However, since this propagation does not consider the natural SSS variability within the considered temporal window, this uncertainty is overestimated.
Comparison with in situ measurements
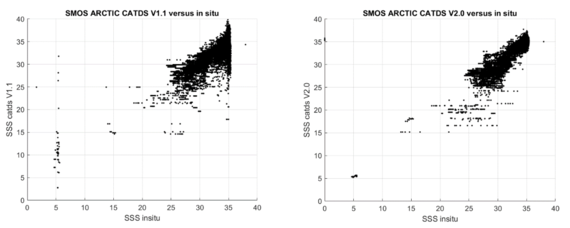
The SMOS ARCTIC CATDS V2 SSS (9-day fields) have been compared with the in situ salinities used by Supply et al. [2020] to validate SMOS ARCTIC CATDS V1.1 SSS (weekly fields). The standard deviation of the difference is reduced from 2.13 to 1.19 with V2.0, while the correlation with the in situ dataset increases (r2 V1.1 = 0.89 & r2 V2.0 = 0.93) (Figure 2).
Figure 2 : Comparison between SMOS ARCTIC CATDS and in situ salinities (same database as in ), left) V1.1, weekly ; right) V2.0, 9-day.
Comparisons with various datasets performed at the Salinity Pilot-Mission Exploitation Platform (PIMEP, see Table 1 below) also reveal much improved statistics, with r2 larger than 0.8 for 40% of the datasets. Users are welcome to visit the PIMEP web site (https://www.salinity-pimep.org) for detailed validations.
References
Boutin, J., J.-L. Vergely, E. P. Dinnat, P. Waldteufel, F. D'Amico, N. Reul, A. Supply, and C. Thouvenin-Masson (2021), Correcting Sea Surface Temperature Spurious Effects in Salinity Retrieved From Spaceborne L-Band Radiometer Measurements, IEEE Transactions on Geoscience and Remote Sensing, 59(9), 7256-7269, doi:10.1109/tgrs.2020.3030488
Boutin, J., J. L. Vergely, F. Bonjean, X. Perrot, Y. Zhou, E. P. Dinnat, R. H. Lang, D. M. L. Vine, and R. Sabia (2023), New Seawater Dielectric Constant Parametrization and Application to SMOS Retrieved Salinity, IEEE Transactions on Geoscience and Remote Sensing, 61, 1-13, doi:10.1109/TGRS.2023.3257923
Boutin, J., J. L. Vergely, S. Marchand, F. D'Amico, A. Hasson, N. Kolodziejczyk, N. Reul, G. Reverdin, and J. Vialard (2018), New SMOS Sea Surface Salinity with reduced systematic errors and improved variability, Remote Sensing of Environment, 214, 115-134, doi:10.1016/j.rse.2018.05.022
Supply, A., J. Boutin, J.-L. Vergely, N. Kolodziejczyk, G. Reverdin, N. Reul, and A. Tarasenko (2020), New insights into SMOS sea surface salinity retrievals in the Arctic Ocean, Remote Sensing of Environment, 249, 112027, doi:10.1016/j.rse.2020.112027
Data References
Boutin J. and Vergely J.-L. (2024). SMOS ARCTIC SSS L3 V2 maps produced by CATDS CEC LOCEAN. SEANOE. doi:10.17882/98769
Data policy
The CATDS data are freely distributed. However, when using these data in a publication, please use the following reference and acknowledgement :
Boutin J. and Vergely J.-L. (2024). SMOS ARCTIC SSS L3 V2 maps produced by CATDS CEC LOCEAN. SEANOE. doi:10.17882/98769
"SMOS ARCTIC SSS L3 V2.0 maps have been produced by LOCEAN/IPSL (UMR CNRS/SU/IRD/MNHN) laboratory."
Acknowledgements
This work was supported by CNES-CATDS and CNES-TOSCA “SMOS-Ocean” projects. We thank S. Guimbard and the PIMEP project for providing in-depth comparisons with various in situ datasets.
Product access
HTTPS access
This research product is freely available on HTTPS:
https://data.catds.fr/cecos-locean/Ocean_products/SMOS_ARCTIC_SSS_L3_LOCEAN/
FTP access
This research products is freely available on FTP:
ftp ftp.ifremer.fr
user: ext-catds-cecos-locean
password: catds2010
chdir: Ocean_products/SMOS_ARCTIC_SSS_L3_LOCEAN
or ftp://ext-catds-cecos-locean:catds2010@ftp.ifremer.fr/Ocean_products/SMOS_ARCTIC_SSS_L3_LOCEAN (no longer works in the recent versions of most of the web browers)
Mailing list
If you want to register to our mailing list to be informed about major events, please send us a message at support@catds.fr (less than 10 messages / year).


